Inside SOTKAnet
This article was written in 2005.
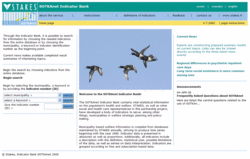
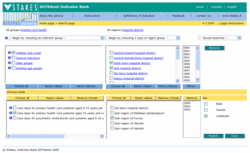
SOTKAnet indicator bank is a public accessible web information service that publishes detailed information on well-being and health in Finland. SOTKAnet was launched by STAKES, the National Research and Development Centre for Welfare and Health, on Monday 14th March 2005 at www.sotkanet.fi. SOTKAnet is currently completely free for all users and every bit of the service is equally available in three languages (Finnish, Swedish and English).
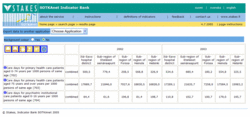
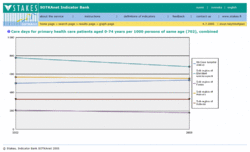
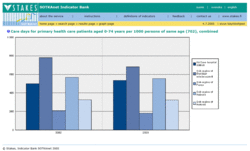
The SOTKAnet web interface is rather easy to use and you get the numbers, figures and maps out from it quite quickly. Despite of simplicity of the web interface behind the scenes there is a custom-built fine-tuned indicator data warehouse that collects, calculates, stores and provides all the data seen through the web interface.
This article gives you a walk trough to SOTKAnet data warehouse and how it was built. Since I was the IT manager of the project and the main architect of the warehouse I will be able to reveal all the best kept secrets of the system. This “Inside SOTKAnet” article is targeted to IT Managers, IT Experts, Systems Analysts and Database Designers. Please feel free to visit SOTKAnet at www.sotkanet.fi to get hands-on experience on the system and the data. You can switch UI language to English at the top right of the screen.
Setting the goals
The basis of the SOTKAnet indicator bank is the data: the indicator data. It is measures that somehow describe well-being and health. Maybe the easiest way to explain what an indicator is is to say that it gives an answer to a question like
- How many patients visited and stayed overnight in hospitals?
- How many percent of adult people have unhealthy eating habits?
- What is the number of violent offenses according to the police per 1 000 inhabitants?
- How many percent of families have children?
- What is the number of confirmed Chlamydia infection cases in a year per 100 000 inhabitants?
The indicator data gives you answers to this kind of questions projected over different administrative areas (whole Finland, a sub region, a municipality etc) and over time. The indicator data is always purely numerical: it is amounts, percentages, sums etc.
You might wonder where all the source data to answer these questions cam from. Well, Finland is a mature state and already had very sophisticated statistical data registers and databases. The entire base data used to calculate SOTKAnet indicators was already collected and made available for our project by organizations like the National Research and Development Centre for Welfare and Health (STAKES), The Social Insurance Institution of Finland (KELA) and the Finnish Centre for Pensions (ETK), to name just a few. SOTKAnet is just a new level of abstraction laid over the raw statistical data sources. It extracts raw data from bulk data sources and refines it into more understandable and sophisticated form.
The idea of indicator bank dates from somewhere late 1990's. At that time I was just starting my IT career on telecom sector. There were attempts to create SOTKAnet kind of systems but only a few of them entered the implementation phase and none of them was ever finished. Our SOTKAnet project started during the early months of 2002 and it ran over three years. SOTKAnet was finally opened March 2005 and the project was considered closed not before June 2005. It is might be easy to say that “what a long running project” but that wouldn't be fair. The SOTKAnet project wasn't actually a project but rather an iterative process: designing and building the indicator bank was everything else but not a straightforward process. Only the last part where we joined our forces with Oracle Finland to build the web interface was a project-like period.
Now let's summarize the main goals of SOTKAnet indicator bank project. In short the goals were
- to build a database to manage indicator data and to create tools to assist or automate data loading, indicator computation and other daily tasks
- to build a sub database to manage the metadata and to create tools to assist metadata collection and input
- to create a web based user interface that provides indictors to users easily and quickly
This article focuses only to the technical side of the project. This might give a reader a false assumption that the project was only about the technology. Well, it wasn't, far from that. I assume that most of the work was done on “the soft side” of the project doing things like defining the indicators and indicator sets, deciding which indicators to include and which to exclude, negotiating to get the access to the raw source data, collecting and typing in the metadata and last but not least organizing the funding for the whole cake. My participation on “the soft side” was tiny. There were other experts to manage all this, and they did a great job. I also would like to thank other IT experts that worked on the project. Although I was the main architect of the warehouse and also implemented the warehouse core there wer also other IT specialists in my team that gave a substantial input to the project. '
Choosing the tools and the vendor
Choosing the right tools for a data warehouse project is a complex task. On the database side we had an easy way out. Our organization had been using Oracle RDBMS since 1995 and it has proven its reliability and scalability. We estimated that the fact table of the warehouse can grow up to 500 000 000 rows so we needed a very scalable solution here. On the web side of the project we evaluated various ways to publish statistical data on web. One of the most interesting was PC-Axis and its subsystem PX-Web which offers a well-structured way to publish statistical tables on the web and to lay them out as tables, figures and maps. After serious considerations and evaluations we decided to go on with a custom-build web interface build on Oracle technology (Oracle Application Server, Oracle Portal). We chose the hard way since the implementation costs would have been much less with PX-Web solution and the project timeline would also have been much shorter. But what we got is the flexibility. Sticking with PX-Web would have been like buying packaged software off the shelf. With a custom-build solution the sky is the only limit for the future of SOTKAnet. Well, maybe we must also consider time and funding…
The data warehouse development was done solely by my team at STAKES. When the warehouse was mature enough to start building the web side on it we started to look for a vendor to design and implement the web interface. After some preliminary steps we chose Oracle Finland to do the job. The web interface subproject can be described generally as a success story. Of course a software project is always more complex than buying a can of milk. We faced many issues during the subproject but all of them were eventually solved.
You might notice that term OLAP (online analytical processing) is not much mentioned in this SOTKAnet article. This is because OLAP technology is not used in SOTKAnet. There major reason for this is that OLAP and BI (Business Intelligence) tools have a philosophy to calculate sums, averages etc. on demand (also know as “on-the-fly”). For many of our indicators this is impossible because the data can't be easily summed up. The calculation of an indicator for different levels does require more complex calculations than OLAP and BI tools generally offer. Also we wanted to maximize the query speed and so decided that the calculations must be done well before the query time, not on-the-fly.
The data warehouse
SOTKAnet's data warehouse runs on Oracle RDBMS (currently on version 9i) and is designed so that it can be accessed with any relational database aware tool like SQL command interface, Web Services API, Oracle Discoverer, Oracle Reports, ODBC and JDBC connectivity and of course by the custom-built SOTKAnet web interface. Oracle's SQL*Plus command line interface is an example of a primitive way to get into the data while the SOTKAnet web interface at www.sotkanet.fi is probably the most sophisticated.
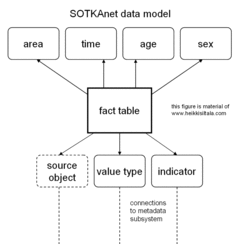
One design goal of SOTKAnet data warehouse was to provide fastest possible query response time. Update and insert efficiency wasn't that important. As far as know it is a fact that the fastest way to provide calculated values to user is to calculate them beforehand and at the query time just fetch the pre-calculated results. We stick to this rule and ended up storing all the pre-calculated indicator values on different dimension levels in a single fact table. So requesting one indicator value from SOTKAnet is technically just fetching one row from the fact table and requesting 500 indicator values from SOTKAnet is to fetch 500 rows from the fact table.
The database design was based on the star schema but I applied some structural changes to better manage indicator data. The resulting data model is called “SOTKAnet star” and a simplified version of it can be seen in the figure.
At query time it works just like any other star: only the dimension tables and the fact table are used at query time so there is now snow flaking. But before the actual indicator data fetching query when the user browses the dimensions in order to make the query, then there are additional tables to help the dimension browsing.
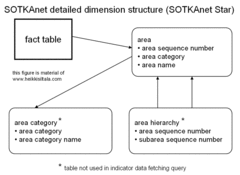
If we take a closer look at area dimension that is described in figure we can see that area dimension consist of three tables. The one connected to fact table is the actual dimension table. It has one row for every municipality, sub-region, region, hospital district, province etc in Finland. The hierarchy between the different levels of area dimension (like what municipalities lay inside a given hospital district) is not stored in the dimension table. These hierarchies are stored in a separate hierarchy table, in this case “area hierarchy”. There is also a third table that holds the possible levels (also know as “categories”) of a dimension. Please note that some dimensions have a little bit different structure and some dimension tables like sex also have a row to mark the situation that the value of the dimension is unspecified. In area dimension there is no such a row since there is no indicator data where area could be unspecified.
Let's take an example on area dimension: user wants to select an area. The system first presents the user the contents of the category table. The users picks one row from there, let's say it is category “hospital districts”. The system then shows the user all the rows from area dimension table that belong to category “hospital districts”. The user picks one hospital district but right after that decides to do a drill-down. The system now uses the hierarchy table to find out what are the municipalities that belong to that hospital district and lets the user to pick the municipalities from that group of municipalities. The user picks up three municipalities and the system stores those dimension identifications. The user then goes thru other dimensions and finally the system has a set of dimension identifications for every dimension. The system now enters the fact table and picks the rows that have the selected dimension identifications. These rows are the query result. If there is no data for a given dimensional combination, there is no corresponding row in the fact table. No indication is stored why the data is missing. We decided to keep the system simple and this was one point where we decided to cut the wings from complexity. Please note that the age dimension of “SOTKAnet star” is currently unused. All rows in fact table point to “unspecified age” row in age dimension table.
All the dimension referencing columns on the fact table have bitmap indexes built on them and there is also a composite primary key b-tree index over the all dimension referencing columns. There is only one fact column and it holds the actual numerical value of the indicator. Strangely enough the fact column is of character type. This is because the data in the fact table is fully processed and should be output just like it is stored. It is already formatted and rounded, and no rounding of formatting should occur at the query time. There is also a trigger to guarantee that only numerical data is stored into the fact column: it users Oracle's “to_number” conversion function and if the conversion fails, an error is raised. The trigger guarantees that we can resist the urge to store character data into the fact column.
Data fetching and loading
There is a custom-built data fetching mechanism that manages the data flow from source databases and other source data systems. I designed the mechanism and it was implemented by me and other IT experts at STAKES. The mechanism is very lightweight but still provides good security and control. Many of the indicator bank's data sources contain sensitive data collected for statistical purposes. Some of the most sensitive are the databases that store data of people's hospital visits. The mechanism makes it safe to connect this kind of databases to SOTKAnet. It provides a detailed control over what data gets shipped to SOTKAnet data warehouse. Due to its lightweight design it is rather easy to manage and the fetching can be scheduled to happen once a day. The details of the mechanism are not described here due to security reasons.
There are also source data systems that are offline. The data from these systems arrive to us in files: ASCII flat files, Excel spreadsheets, PC-Axis files or SAS files. We have built data loading aids to ease the file loading process.
Indicator computation subsystem
When the source data has been shipped to the indicator bank it is time to calculate the indicators. Only a small number of indicators come in already calculated. Most of the indicators are calculated inside the indicator bank using the indicator computation subsystem. We evaluated various ETL tools like Oracle Warehouse Builder and tested how they suit for our computation needs. We found that a special indicator calculation subsystem developed by me that is based on use of Oracle's materialized views is the best solution to manage the computation process.
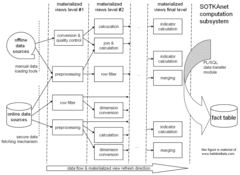
The indicator computation subsystem is one of my innovations that I'm very proud of. It provides very fast data flow, accurate results, easy management and fast error tracing. An overview of it can bee seen in the figure.
It is actually a set of database objects. It consists of huge load of PL/SQL code to control and to manage process, some support tables to store state and statistical information and a large number of interconnected materialized views (also known as “nested materialized views”). Materialized vies are a feature of Oracle database. Nested materialized views are the actual objects that calculate an indicator value. We call a set of nested materialized views that calculate an indicator “a chain”. A chain consists of a number of materialized views that we call “the rings”. The rings are organized into levels. Level 1 is the nearest level to the data sources and the data flows from level 1 to level 2, level 2 to level 3 etc. A ring in a level is allowed to use only the rings on levels before its own level as sources. I have managed built a rather complex PL/SQL package to handle the refresh flow, to transfer the data from the last level of rights to the fact table, to control the error situations and to calculate and store metadata and control information of the calculation process. The implementation of such a PL/SQL hassle was a hard task but now on its third generation it runs smoothly.
Creating a new ring is done by inserting the select clause of the materialized view into a special table. The table stores the query and a trigger gets fired. The trigger creates the corresponding materialized view. When it is time to delete a ring, the corresponding row is deleted from the special table. The trigger gets fired and it deletes the corresponding materialized view. This indirect mechanism has many benefits. One is that when an error occurs the error code and error text gets stored on the corresponding line in the special table. This makes it possible to let the refresh mechanism run background. Monitoring the refresh mechanism is then done by querying the special table for any errors. Another benefit comes up when there is a need to change a large amount of rings. It is often possible to write string manipulation clause against the column that stores the select clause. When the clause is run and the select clause gets modified. This fires a trigger that replaces the corresponding materialized views. In this way it is possible to modify for example 500 rings using only 4-5 rows of PL/SQL code.
As some of the Oracle-aware readers might already have noted the indicator computation system is actually based on misuse of Materialized View technology. The official use for materialized views is to provide transparent query rewrite. Well, strangely enough my unorthodox way of using it works just fine. If you want to make innovations, don't hesitate to walk over the manuals.
The metadata subsystem
The role of the SOTKAnet's metadata subsystem is to store and manage three types of metadata which are
- indicator bank's internal technical control and monitoring data
- the internal metadata aimed to indicator developers to keep track indicator development and indicator lifecycle processes
- the metadata that describes the indicators and is viewable thru SOTKAnet web interface's metadata screens
The importance of the metadata is high. To emphasis this a little bit more I can say that without the metadata there would be no use for the actual indicator data.
The metadata subsystem consists of a user interface for our internal users and a relational database tightly integrated with SOTKAnet data warehouse. The technologies used are rather traditional - no innovations here, sorry. The basis of the database model was Dublin Core standard. The model then matured and grew to have over twenty tables. The user interface for internal user was build with Microsoft Access and it connects to Oracle via ODBC. This kind of client-server implementation has proven to work fine. There is only a fistful of users that use the internal metadata user interface and a web interface is not needed here.
The web interface
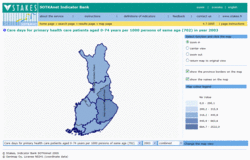
SOTKAnet web interface available at http://www.sotkanet.fi is the channel from the indicator bank to the web. I never stop wondering how simple it makes everything to look like. Just go there and fetch the data you like. You don't have to know anything about the tremendous efforts and the innovations required to build the data warehouse under it. The web interface succeeds in hiding all the complexity. The web interface is built on Oracle Application Server and Oracle Portal and it is designed and implemented by Oracle Finland. My role was only to contribute the process. Most of the presentation components seen on the interface are portlets glued together by Oracle Portal. The implementation languages of the portlets were Java (J2EE) and PL/SQL. The web interface also utilizes Oracle Map Viewer which is a part of Oracle Application Server.
The bottom line
Designing and building SOTKAnet was the largest and longest running IT project I've ever participated. The hours spent with the subject are both numerous and uncalculated. I wonder if I will ever again have a possibility to take part on a project of this magnitude and running time. Please note that total running time was mostly doing the background work and building the data warehouse. Building the web interface took rather a short time.
During the project I managed to add some knowledge of welfare and health indicator data into my repertoire. The data from this sector of society has of course some special characteristics. But generally the challenges of data management seem to be very close to each other on different sectors. I have now worked with data management in telecom sector, environmental sector and welfare and healthcare sector and the demands and challenges on data management are quite same in all of these sectors.
What's next
There is a long list of enhancement request and ideas for the future of SOTKAnet. One of the ideas is define and implement super indicators, which group together a number of regular indictors. There have even been talks to create a hyper indicator that could be just one value that tells you the state of the welfare in Finland on a given time. The scope of SOTKAnet's data is currently limited to Finland only. There have been discussions that in future there could have data from all the Nordic countries or even from the whole European Union.
On the technical side SOTKAnet indicator bank runs currently on dual processor 32-bit Windows servers structured so that there are separate server to run the application server and another for the database. The capacity seems to be on target and there is no need to buy new hardware in sight. We do seem to have some instability issues that might origin from the operating system. In the future we might come into a point of discussing the operating system changeover.
The future development of SOTKAnet is of course constrained by funding. Due to this fact The Ministry of Social Affairs and Health has the dominant role when discussing on the future development of SOTKAnet.
About the author
Mr. Heikki Siltala, the author of this article, works as an IT Development Manager at the National Research and Development Centre for Welfare and Health, Finland (also known as STAKES). He has specialized on large relational databases and data warehousing but has also skills on project management, team leading, IT systems design and industry-level software development. He has IT job experience on private telecom sector, on environmental systems and on health/welfare data systems. In addition to his experience on demanding real-life projects and development tasks he has M. Sc. on Computer Sciences from the University of Helsinki.

